How can you use Bubble and DevTools together to improve your app’s security and performance?
As it turns out, DevTools can help you in several different ways, and is an excellent tool to reveal information that Bubble’s own tools simply can’t. It also offers a word of caution that there’s a lot of information related to Bubble security that a basic bootcamp, official documentation and self-learning simply doesn’t teach you. Some of it may surprise you, and you wouldn’t be alone: Bubble is easy to use, but the lack of best practices can be worrying and should be taken seriously.
For a complete guide on Bubble security, you may be interested in our book The Ultimate Guide to Bubble Security. But for a faster look at how DevTools can help you quickly identify some common culprits, let’s dig in:
What is DevTools?
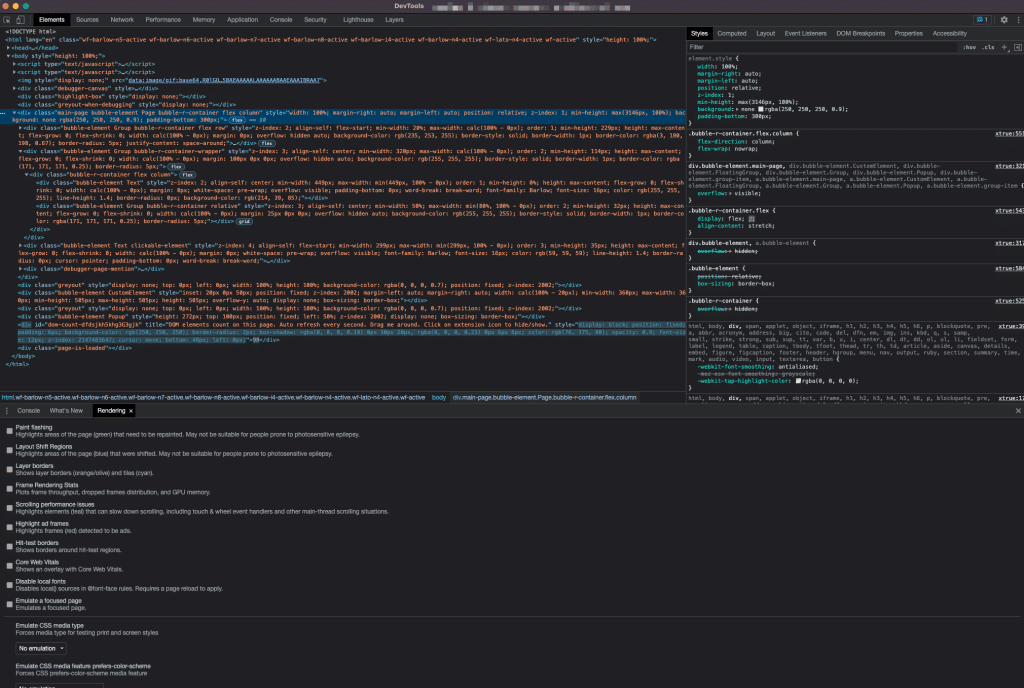
Chrome DevTools, short for Developer Tools, is a suite of handy developer tools built right into the Chrome browser. For Bubble builders, it may not feel that familiar, but traditional web developers use it routinely to experiment with and debug their work. DevTools let’s you quickly manipulate the design of the page (changing Elements, Conditions and CSS), debug JavaScript by setting break points on specific lines or events, or going step-by-step (just like Bubble). It also features something called the Console, which lets you run JavaScript and see the results immediately in the open browser tab.

If you’ve opened DevTools without really knowing how it works, its most prominent feature may just be its clunky, overwhelming interface. It’s just not a sexy tool. But it does the job, and without it, we’d be working blindly trying to understand our page’s security, network events, performance and lots of other stuff. Firefox has its own version of Developer Tools called….🥁🥁🥁 Web Development Tools. Microsoft went to town and called the Edge version DevTools. Yay for creativity among developers.
The functionality and even design of these competitors is fairly similar, so while we’ll be focusing on Chrome’s solution for this article.
How to open Chrome Developer tools
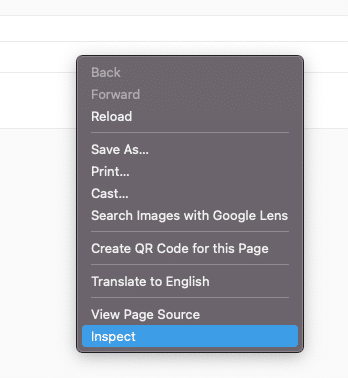
The easiest way to find DevTools is to click ⌥ ⌘ I on Mac or Control+Shift+I on Windows. Make sure you have the page you want to analyze open when you do so. You can also right-click and select Inspect on any Element on the page:

This will take you directly to that Element’s line of code in the page’s HTML. Note that DevTools doesn’t record activity until it’s open. For the Network tab, you may need to reload the page to see any information.
Ensuring a fresh download
Chrome (and all other major browser) keeps a lot of downloaded content from different website cached in a folder to avoid having to download it again. This can skew your analysis, since different assets on your page have already been downloaded. To avoid this, you can open up the application in Incognito mode. This way, you’re testing the page with a completely blank slate and you avoid browser extensions that may pollute your results.
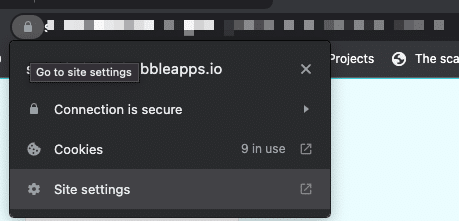
If you prefer not to use Incognito mode, you can also delete the browser data for the page, but this is pretty cumbersome in the long run. Do this by clicking the lock in the URL bar, then click Site settings and finally Clear data. This only clears data for that specific page.

Ok, with DevTools open, let’s have a look at a few things we can do with it:
1. Analyze which assets your app downloads (that slow down your page)
The first point on our list is the simple and visual way in which DevTools let’s you identify many of the culprits that slow down the loading of your page. Let’s first go over quickly what we’re talking about here: as we explore in-depth in the book The Ultimate Guide to Bubble Performance each time a page loads, your browser has to download a lot of different resources to make that magic happen.
The first category of resource network activity is files that are needed to render the page correctly and allow for its functionality to work. Typical examples include:
- JavaScript files that are needed for your app to behave like you expect it to (Bubble’s on-device “engine”). Plugins can add extra JavaScript files to your page even if the plugin is not in use on that page.
- Fonts: adding fonts to your app means that font (and all of its used variants) has to be downloaded to the browser
- Images: Each image on your page (either static or the result of a search/saved on a database Thing) needs to be downloaded too
The second category of network activity is searches.
- Do a Search for: every time you tell Bubble to search for something a query is sent to the server, which performs the search and sends the result back. The performance of this depends on a lot of factors, like the Data Type’s Data Weight
- The Current User: information about the Current User is downloaded on page load.
- If the User hasn’t signed up yet, this only contains the Unique ID (which is generated before a User signs up)
- If the User has signed up, it includes every field the User has access to through the app’s Privacy Rules
As a Bubble builder with no previous web development experience, the need for those assets and the tax it can have on your performance can come as a surprise.
Ok, so how do we know all this? The answer lies in DevTool’s Network tab. As the name suggests, this tab reports all network connections that your page makes while it loads and during your continued use.

After opening the Network tab, you may have to reload the page for Chrome to record the network activity. In the screenshot below, you can see the assets loaded on a completely blank Bubble page.

As you can see, without adding anything to the page yet, Bubble is making a long list of requests already.
- In this list you can see all the assets that are causing network activity. Of course, this is not in itself a bad thing. Your app would be a sorry place with no network connections. As you can see, several of these requests are different variations of the Barlow Font.
- In the bottom row, you can quickly identify the number of request and their total size
- The size row shows you the size of the asset, and whether it has been cached locally or not. What this means if that if your browser downloads a font (and many other assets), it only needs to download it once. In this case the font was already in the browser’s cache, so the download size was 0 b and it took 0 ms. If a User visits your site for the first time, the load would have been slightly longer.
So this can be a bit confusing – a long list of requests that keeps growing with your page. Let’s look at how we can slim it down a bit:

Using the filters like illustrated above let’s you analyze one category of assets at a time. This way, you can easily identify different sources of slowdown, like the adding of a new font, the size of different images or how much a given plugin adds to your total size.
2. Check the size and processing time of your Searches
The time it takes to complete a database search depends on two things:
- How long it takes the server to complete the query
- How complex it is
- How much data there is to sort through
- How long it takes for your device to download the results
Searches that slow your page down are in most cases the fault of the developer – Bubble’s server is pretty damn fast. But with the wrong database structure or a high Data Weight can lead to searches not performing as well as they could. It can be difficult to pinpoint an exact cause: you may be performing multiple searches on a page, and it may not be clear which one is the most demanding.
Again, we turn to the Network tab in Chrome DevTools. Using the filters in the screenshot above, click the Fetch/XHR tab. This tab shows the requests going back and forth between the server, such as a database query.
How to identify searches
Bubble uses Elasticsearch, which is a third-party JSON-based search and aggregation engine. Using Elastic.io’s software, Bubble places an API call whenever you use the Do a Search for function, leaving easily recognizable traces in our DevTools list.
For searches, there are two terms you need to be on the lookout for: search and msearch. Just like files, these requests will show up with a download size and the time it took to complete the request.

Selecting the search request (1), we can see the response your device received from the server. Click Preview (2) and expand the ▼ arrows (2) and there it is – in plaintext.
From a performance perspective, this let’s you check the performance and size of your different searches. From a security perspective, you can chech all the raw data the server is sending to your device, and see if your are accidentally downloading more data than you intended. If you are, you need to implement stricter Privacy Rules or change the Conditions on the search.
What you’ll notice about searches as compared to files, is that they’re not cached by your browser. In other words, they have to be downloaded every single time the page loads, making them especially important to prioritize if you’re looking to analyze performance issues.
Using the waterfall report to visualize loading times
Seeing these reports can be helpful, but they can also make it difficult to see the forest for the trees. Chrome’s waterfall report is a visualization that shows the time it took each request to complete. Not only does this give you a easier-to-read overall understanding of the how your page loads, but culprits that add a lot to your loading time also stick out like a sore thumb. The waterfall visualization is located next to the Time tab and may require some scrolling on smaller screens.
In the image below I’ve added a search to the page requires some extra time to finish.

I happened to select a search here, but you can also use this to identify other slow-loading resources. The size is not always the worst part for example. If a plugin is downloading a JavaScript file from a really slow server, it can add to the total waiting time simply because the server is slow to respond. In that case, you may need to re-evaluate the use of that plugin to get rid of the delay.
Keep in mind that the time it takes for an asset to load can vary greatly from a minute to the next. Don’t trust the first result blindly, but let it run a few times at different times per day. If an asset is consistently slow to load, you can investigate further.
Find app information hidden away in Bubble’s code (that you thought was secret!)
You can think of Bubble’s “engine” as existing in two places: one is on the server, managing the database and all other server-side operations. The second is on the device of the User, taking care of all client-side actions (like registering button clicks, animating and hiding/showing elements, navigating to other pages and sending requests to its sibling on the server.
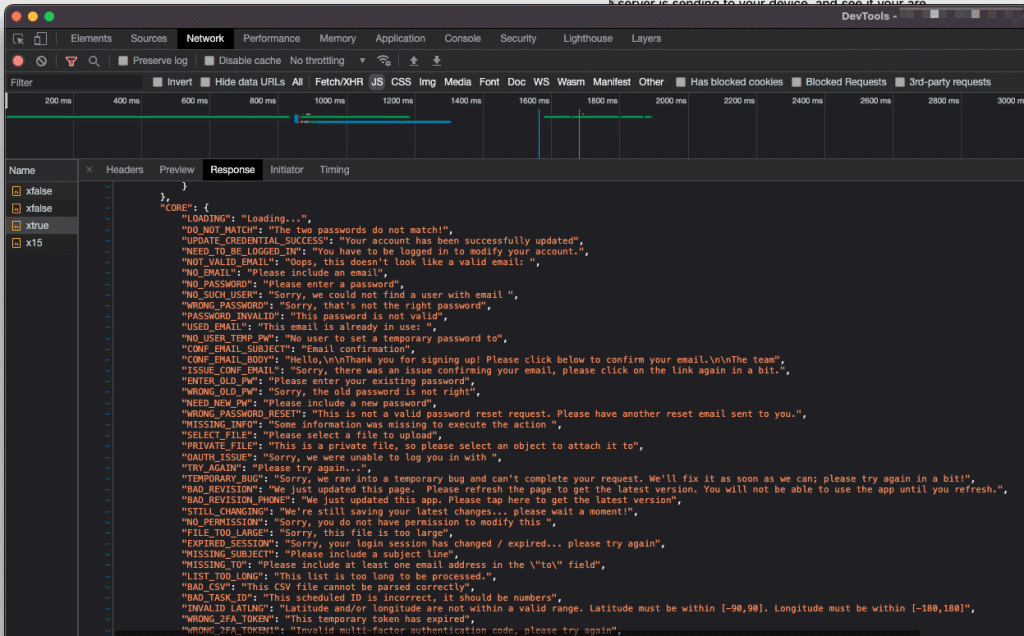
The latter is a set of JavaScript files that contain a lot of different information used to make your app work. Many of these points you may not be aware that you’re sharing:
- The names, fields and default values of all your Data Types
- Including deleted Data Types
- The names of all your Styles
- The names, options and attributes of all your Option Sets
- The editor names of all your Elements
- All Translation texts (app texts)
- Your Bubble app ID
- The timestamp that your app was last updated (in Unix time)

With this knowledge in mind, you may have to change some of your security practices. Features like Option Sets, Translation texts and even editor content like Page names and Element names are not secure. While they’re obviously not meant to be, this is still pretty undercommunicated by Bubble, and opens up to risks of data being inadvertently exposed.
Chrome can also be used for other debugging purposes, like changing the current geolocation and time zone in DevTools to test your app without buying plane tickets to circle the globe.
This article is just a short sample of the security best practices that you can find in our book The Ultimate Guide to Bubble Security.


